Every month, ARMLS® publishes their data and analysis of the Phoenix Metro housing market. It provides insights into trends, indications and predictions. Take a look at a graphical analysis of the market’s current trends.
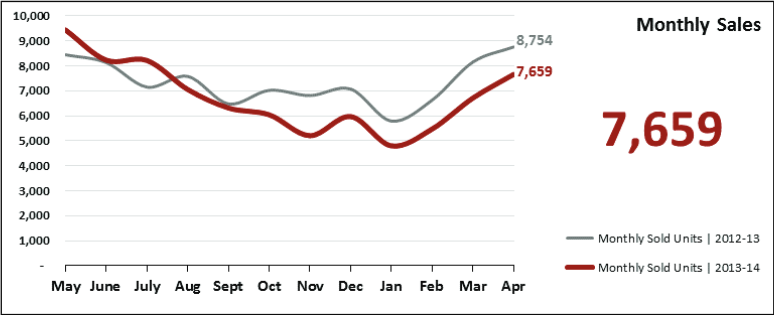
There were a total of 7,659 sales in the month of April. An increase in 14.1% over March. However down 12.5% from April of last year.
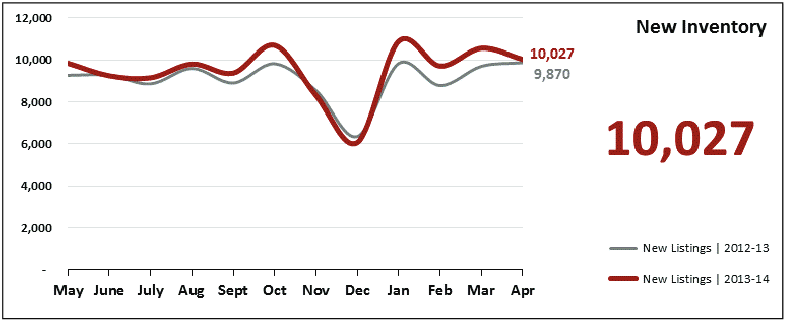
There have been 10,027 new homes added to the market during the month of April. A decrease of 5% over March. However this is a 1.6% increase of April of last year.
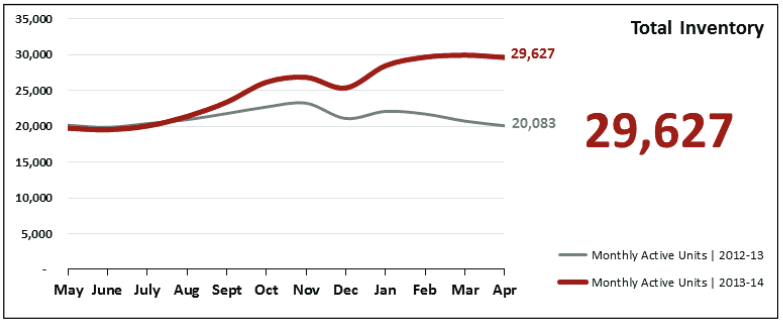
There are a total of 29,267 homes on the market in Phoenix as of the beginning of May. That number is down just 1% from March. However it is up a whopping 47.5% over last years number of 20,083.
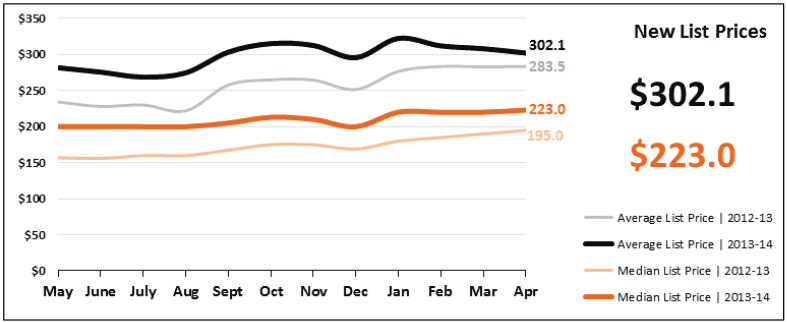
The average list price for a home hitting the market in Phoenix is at $302,100. That is a 6.6% increase over last years price of $283,500. The median price of a new listing is $223,000. That is a 14.4% increase over last years price of $195,000.
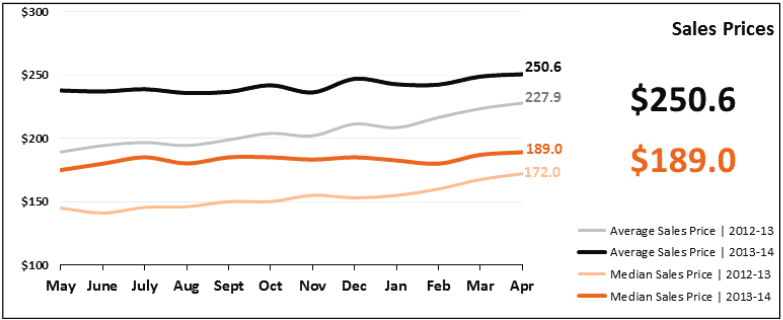
The average sales price of a closing home in April was $250,600. That is a 10% increase over last years price of $227,900. The median sale price of a home in April was $189,000. That is an increase of 9.9% over last years price of $172,000.
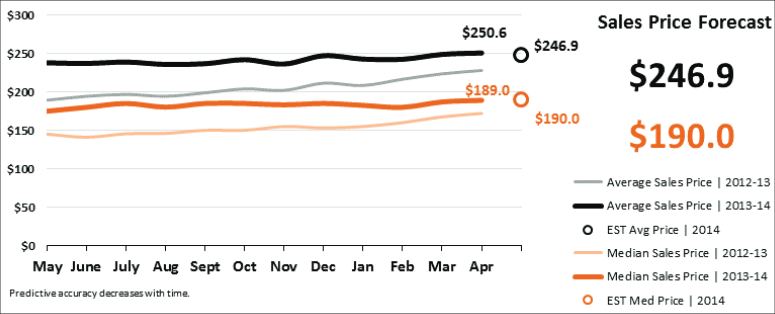
The average sales price for May is predicted to fall by 1.5% to around $247,000. The median sales price for May is predicted to increase by .5% to around $190,000.
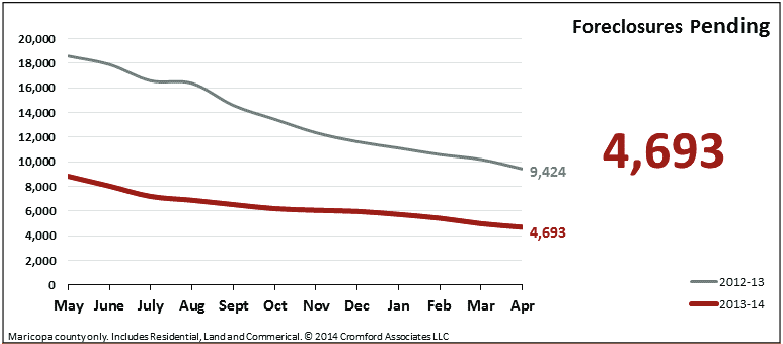
The total number of foreclosures pending in Phoenix at the beginning of May is 4,693. That is a huge decrease of 50.2% over last years number of 9,424.
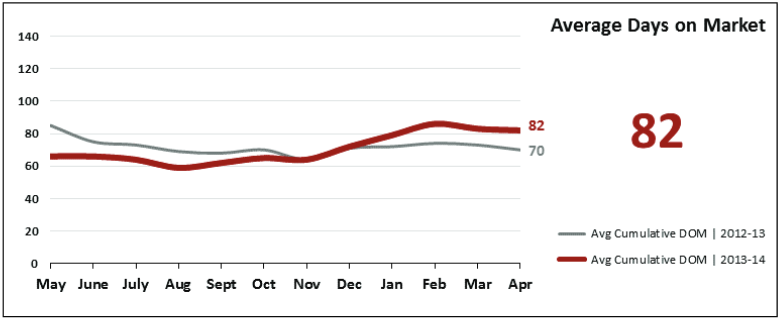
The average home spent 82 days on the market during the month of April. That is a 17.1% increase over last years number of 70 days on the market.
For a more detailed analysis and explanation of these numbers visit the original post at ARMLS.

 Noel began his real estate career as a leasing agent, closing 4 leases his 1st week on the job. Since 2006, he has personally leased over 600 homes, signed up over 1000 new owners for management, and has sold over $500 million in real estate almost exclusively to, and for the benefit of investors. As the original employee, and now Broker for HomeQwik, Noel has not only assisted in the creation and management of the company, but also in the processes that make HomeQwik #1. As an owner of 2 rental properties himself, Noel also has personal experience as an investor, and has a true passion for helping others realize their investment dreams. He continues to work on building his own real estate portfolio, and is shopping for buyers in our market every single day.
 Jason Stieglitz is a Realtor and Property Manager at HomeQwik, a firm that specializes in all aspects of Residential Property Management. Jason has been an Arizona resident for almost 40 years, and in real estate since 2009. Formerly in construction, Jason can apply some of that knowledge to maintenance problem solving with your investment property.
 Mike Sargent – Founder/Real Estate Investor
 Jim Hughes – IT Manager
 Janie Scarborough – Business Development Manager for Prescott/Quad City Territory
  Gk Pavillar – Manager of HomeQwik Remote Operations